| Home | > | Software | > | Stock Models | > | Volatility Tool | > | Volatility
Tool Demo |
Pages:
1 |

Public Company Volatility Service
Forfeiture & Expected Life Tool
Download our Whitepaper (494KB)
|
Overview
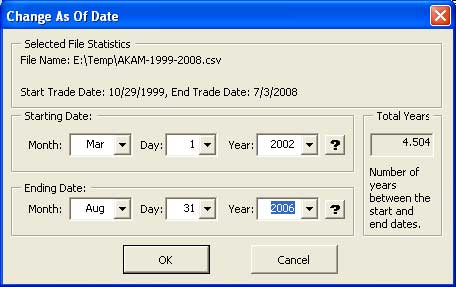
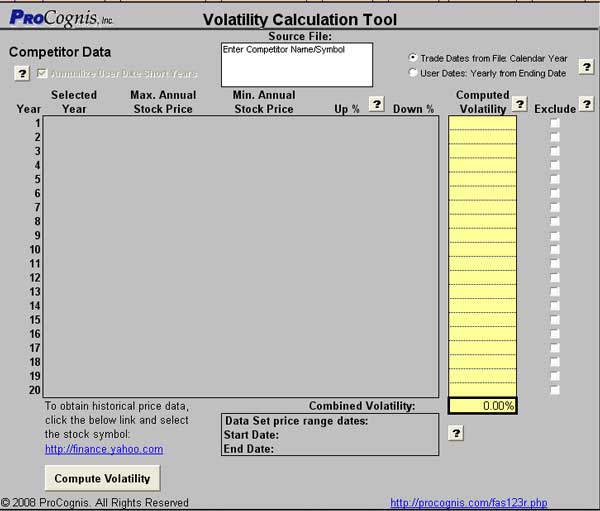
Current Accounting Standards Codification, ASC 718 (formerly FAS123r) requires that companies that issue stock-based payments must now determine a valuation and expense these options in their financial statements. Options valuation models require a volatility input to estimate potential stock price movements over the life of the option. The volatility input is generally the most important single input into the stock models since price fluctuation strongly effects the stock option's potential future value. So, high volatility inputs will tend to create high stock option valuations and low volatility will tend to produce lower stock option valuations (with all other inputs remaining static). To compute this stock price volatility, it is necessary to obtain a measure of stock price changes over a significant period of time and to apply a reasonable method to determine a percentage change for each annual period. The computed annual volatility can then be combined into an average of the volatility for those years. We offer two versions of the Tool: the Standard Edition and the Advanced Edition. The Standard Edition computes volatility on a calendar year basis (calender Janauary 1 through December 31). The Advanced Edition allows the user to choose between a calendar year computation and an annual computation with user-specified dates. See Figure 1. In the Advanced Edition, partial years can be annualized (unlike the Standard Edition). Please see the FAQ for information about the Volatility Tool.
The Yahoo!® Finance website provides a wealth of stock price data including historical prices for all publicly traded stocks on the major exchanges. The Volatility Tool is designed to use the output files from Yahoo!® Finance historical price quote service. To obtain data from this service simply open a browser and enter the http://finance.yahoo.com URL and select the 'Historical Prices' link under the 'Quotes' header. Select a stock symbol and a date range (it defaults to start at the IPO date and end at the current date). Also, select 'Daily' for the frequency to collect daily price data. Click the 'GO' button when you are ready and the data appears in a table on the browser window. At the bottom of the page you can save the data by clicking the 'Download to Spreadsheet' link. Simply save the file when prompted and you have the necessary data to compute volatility using the Volatility Tool. The data downloaded into the file is stored so that the trading prices for each day is listed in descending order by date and the last column data has the price adjusted for splits, dividends and other stock price affecting events (adjusted to reflect current pricing even for historical data output). We use the adjusted stock price to make valid comparisons over long time periods of time in our computations. When you have saved the file you can now open Volatility Tool and use the historical stock data to compute the volatility. See Figure 2.
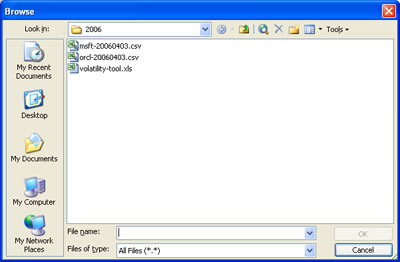
Simply click the 'Compute Volatility' button as shown in Figure 2 to compute the historical volatility. You will select the data file you saved from Yahoo!® Finance during the computation process using the familiar File 'Browse' dialog box as shown in Figure 3.
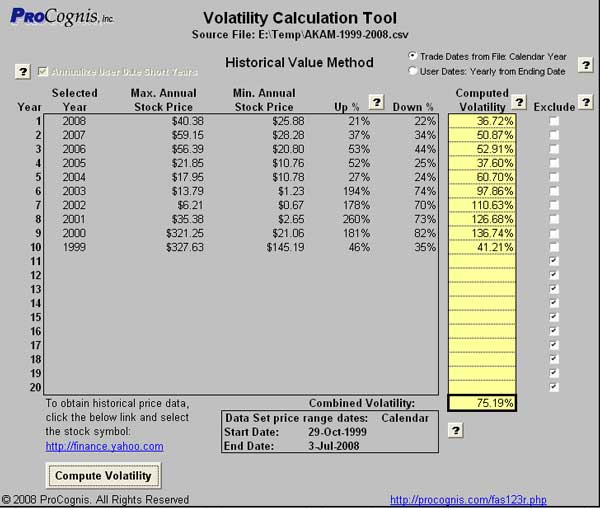
Once you have selected a data file to use in the computation, the data file is verified to ensure that it is correctly formatted and the historical price data is then used to compute the annual volatility. The output of the computation is shown in Figure 4.
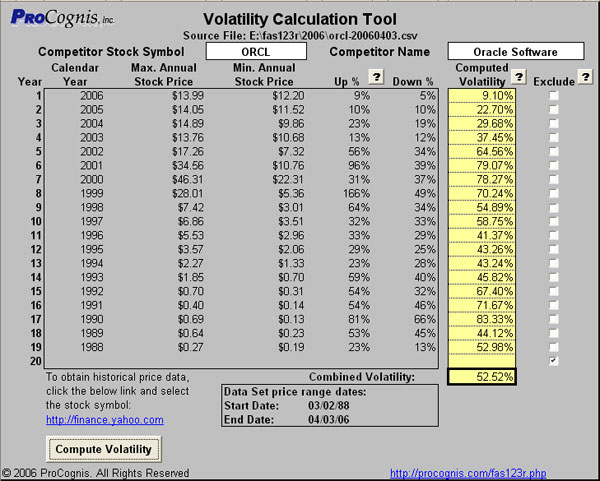
Computation Methodology The volatility computation method implemented in the Volatility Tool uses a logarithm ratio of daily stock price changes and a Root-Mean-Square of the daily ratio. The logarithm division and Root-Mean-Square methods are used to compare percentage stock price differences (instead of dollar differences) and we feel that this is a much more sophisticated method to find price fluctuation. Methods that use the simple average stock price over the year will tend to produce inaccurate volatility measurements. The two versions divide the years differently. The Standard Edition (or the Advanced Edition with the 'Trade Dates from File' option selected) parcels up the years based on the calendar (January 1 through December 31) regardless of the input data. So the Standard Edition computation will create two partial years (last and first years) if the trading dates to not align to the calendar. Conversely, the Advanced Edition uses the user-specifed dates (entered in the input screen in Figure 1) to determine the yearly break-points and will only produce one partial year at most. Also, the Advanced Model provides the option to annualize the partial data computation (or adjust a partial year's volatility to extrapolate out to a full year). The Advanced computation may be a better fit to compute volatility based on trades more closely conforming to the option's grant specifics. Computed Data Output There are two types of volatility numbers reported: Annual Computed Volatility computed for each year and the Combined Volatility that is a simple average of the selected years. Some years computed annual volatility may need exclusion because the year is shortened (such as the company's IPO year) or there may have been unusual trading patterns that may skew the Combined Volatility. To address this, there is a checkbox in the 'Exclude' column that removes the checked year(s) from the Combined Volatility average. The other data reported as output in the table as shown in Figure 4 includes the Calendar Years included in the data set, the maximum and minimum adjusted stock price found during that year and the Up and Down percentage adjusted stock price movement from the computed average stock price during that period. Additionally, the name an path of the input file (under the heading) and the date range found in the input file (box under the table) are listed on the sheet to provide details of the data used to create this finding. Volatility Sheets The Volatility Tool provides four separate sheets to save volatility computations: the 'Company Volatility' sheet and three 'Competitor' sheets. The competitor sheets are provided in cases where the company may not have adequate trading history (including non-public companies) to cover the potential life of the option grant or when additional stock volatility for companies in the same industry segment is needed to provide additional support for the volatility finding. The 'Competitor' sheet is essentially the same as the 'Company Volatility' sheet but there are fields to enter the stock symbol and company name of the stock data used to compute the volatility. See Figures 5 and 6 for an example Competitor sheet.
|
Volatility Computation from historical stock data Easy Computation using freely available historical stock data Troublefree solution for only $349! |
Financial Reporting Solutions
©2006.
ProCognis, Inc. All Rights Reserved. Modified
May 24, 2011
Service
Agreement & Privacy Policy